
Ranking procedure of Jury

ALL WINNERS of the DACH Award December 2025 – 15 use-cases in various categories!
Similar Listings
2

Retail Technology
Immersal City-Scale
with
Immersal
The Immersal City-Scale is designed for ease of use, allowing mobile network operators to integrate it into their existing infrastructure seamlessly. This eliminates the need for complex and costly deployments, making the technology accessible to a wider range of businesses. Immersal is dedicated to bringing the most advanced and innovative technologies to t ...
2
NRF Retail`s Big Show
Retail Technology
iShelf Insights
with
Best Buy
With Wipro’s iShelf Insights, associates can drive compliance in visual merchandising and ensure shelves are fully stocked. With the solution, associates can capture a shelf image, detect anomalies in real time (e.g. misplaced items or missing items), generate real time error reports for corporate, and execute corrective actions on the fly. This drives ...
2
NRF Retail`s Big Show
Retail Technology
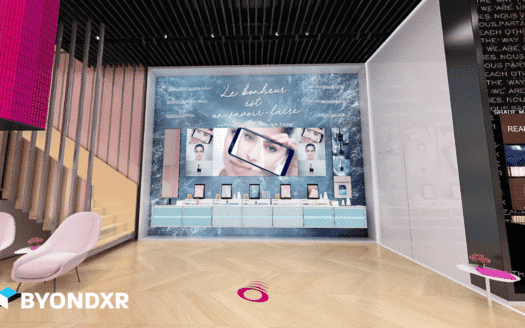
Virtual Stores – Transforming Retail with vi...
with
L'Oreal, Estee Lauder, Mondelez, Calvin Klein and many others.
Online shopping can be a tedious and uninspiring experience, with many websites offering dull feeds and achieving low conversion rates. It’s difficult to recreate the excitement and engagement of shopping in a physical store. But ByondXR is here to change that. The innovative platform uses immersive 3D simulations to bring the in-store experience onlin ...
2
Retail Technology
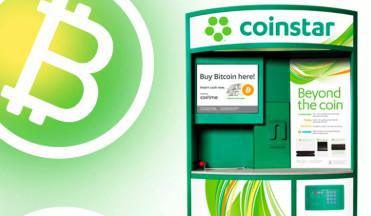
Coin-counting solution kiosk
with
Coinstar
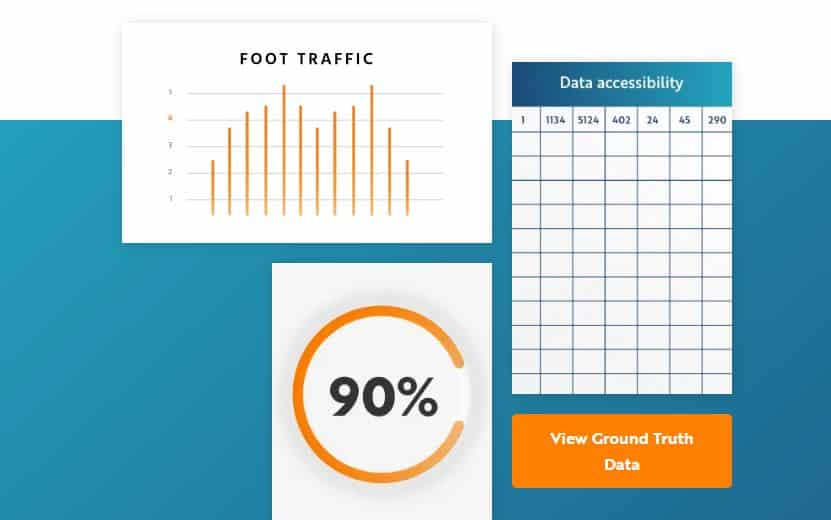
Consumers trust Coinstar® kiosks to provide a convenient and reliable coin-counting solution. We’ve built our reputation on 25 years of customer service and more than one billion successful transactions since our first kiosk was installed in 1992. With nearly 20,000 kiosks worldwide, Coinstar kiosks are easy to find and use. In fact, 90% of the U.S. populati ...
3
Retail Technology
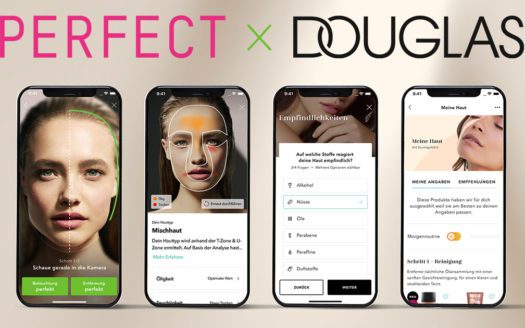
AI-powered skin type analysis tool from Perf...
with
No retailer found
The AI-powered skin type analysis tool was implemented by Douglas in July 2022. It is a completely new, customized solution that allows customers to determine their skin type and other skin characteristics via the DOUGLAS app. The skin analysis is based on AgileFace® tracking technology, a patented technology from Perfect Corp. that enables ultra-accurate vi ...
3
Retail Technology
Product Delivery and Pickup
with
Crate&Barrel
Crate&Barrel uses the Glympse location data platform to enhance their product delivery by providing real-time geolocation visibility and transparency as to when their customer can expect to receive the goods they purchased. Crate&Barrel uses the Glympse En Route and the Glympse Software Development Kit (SDK) to provide real-time geolocation services ...